In October 2020, Google Analytics announced a new version called Google Analytics 4 (GA4), so we’ve put together this short guide for business owners for everything you need to know about this change.
GA4 is due to replace the current version of Google Analytics (Universal Analytics or UA) in June 2023. This means that in couple of months you’ll be using GA4 regardless, and it’s important your data is migrated carefully to avoid any loss.
What does that mean for you?
It's quite simple - if you don't switch to the new Google Analytics 4 (GA4) by 01/07/2023, you will stop receiving all the data that the current Google Analytics allows you from that day.
You will lose the ability to analyze and track users, and thus also to make strategic and data-driven decisions based on accurate data.
July 1, 2023 seems a long way off, but it's critical for businesses to get started now to get a solid understanding of how Google Analytics 4 works and how to leverage the platform's insights to achieve your business goals.
What is the Difference Between Google Analytics 4 and Universal Analytics?
The most obvious difference between Google Analytics 4 and Universal Analytics is that GA4 enables you to report on activity that occurs on both websites and applications. There are a number of other differences, including:
Google Analytics 4 Has a New Dashboard
The first change you are likely to notice is the entirely new dashboard. It is more streamlined and many of the reports you are used to are gone or have been moved. The navigation bar to the right includes buttons for home, reports, explore, advertising, configure, and library.
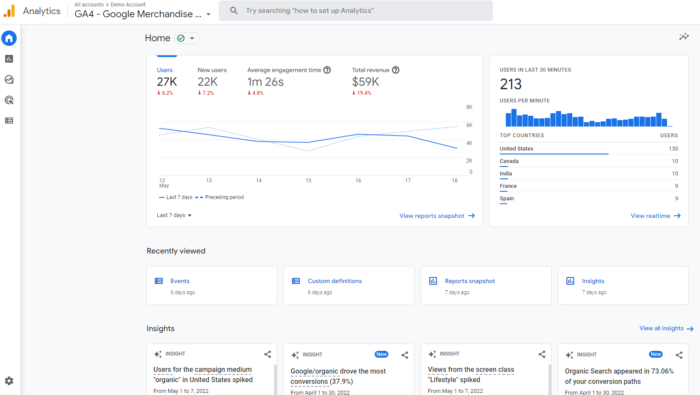
At the bottom, under Insights, you’ll see predictive insights based on Google’s AI. I’ll dig more deeply into the features and what they mean in a later section, so keep reading!
All Measurements Are Events in GA4
With Universal Analytics, page views were the most important metric. With Google Analytics 4, all measurements are events. Instead of seeing generalized data, you can now gain a fuller understanding of how users interact with your app and website.
What does this mean for you? You can still view session-level reporting, but the ability to break it down by interaction means more in-depth reports and insights.
GA4 also has an array of new metrics. These include engagement metrics such as:
- engaged sessions
- engagement rate
- engagement time
It also tracks a number of other dimensions, including attribution, demographics, events, and so forth.
This is a big change, but it’s actually going to make it easier to track customers throughout their journey. GA originally assumed page views were the most important metric—that is no longer true. The new parameters might have a learning curve, but you will have access to more data.
Cross-Platform Tracking
What happens when users are active on more than one platform? With the old Google Analytics, tracking users across platforms was nearly impossible. The new Google Analytics 4 tracks both web and app data in one property (hence the beta name of Google Analytics App+Web).
How Do I Use Google Analytics 4?
Now that you understand the power of the new Google Analytics platform, I’ll walk you through how to use it. I will say there is a learning curve for the platform, and that can definitely be frustrating. Start by following the steps below. This will help you understand the basics and how to navigate the new platform.
Test The New Search Bar
The search bar in GA4 lets you access more than ever, including instant answers for specific queries (such as “how many users this month vs last year”), specific reports or insights, property configuration, or to access the help content.
Try a few queries to see what you can access, such as “how to create a report” or “top users by city.” As you learn the new dashboard, the search board will be invaluable.
Get To Know The New Dashboard
Now let’s look at the new dashboard. At first glance, it might look pretty familiar. Take a look around, however, and you’ll see most of the reports you’re used to are not where they used to be.
Here’s an annotated version of the dashboard. I’ve labeled the navigation bar on the left as well as the different displays. For this walk-through, I’m using GA’s demo account (Which you can access here), so it may look a bit different than your version, especially if you’ve already started customizing it.
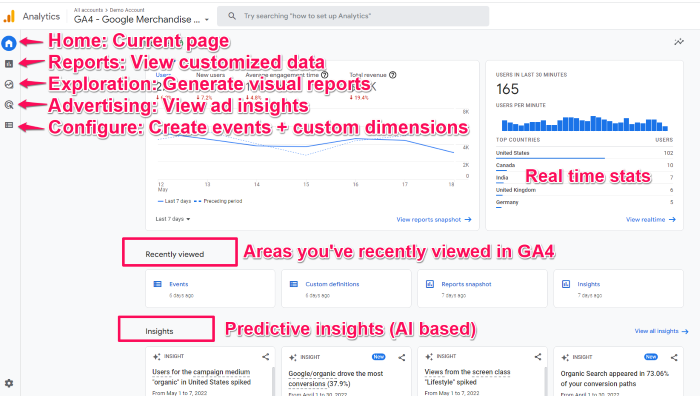
NOTE: A few of the navigation menu items including Audience and Library aren’t in this screenshot, but should be accessible in your dashboard if you have editor access.
Explore The Reports Dashboard
From the dashboard, click on the second icon on the left nav bar. This will take you to the reports dashboard, which shows you snapshots of different reports. Most of the reports you are used to seeing are in this tab, though they may look a bit different.
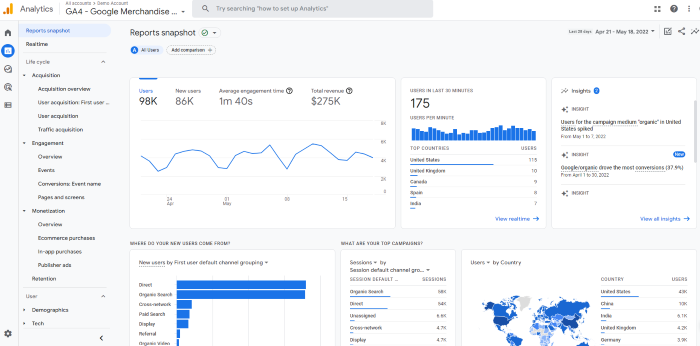
There’s a ton of data here. I won’t walk through all of it because different sites will track different metrics, so yours might look different.
But let’s say you want to see how many people viewed a specific page. In this dashboard, you’d click “engagement” and then look at the “Views by page title and screen class” chart.
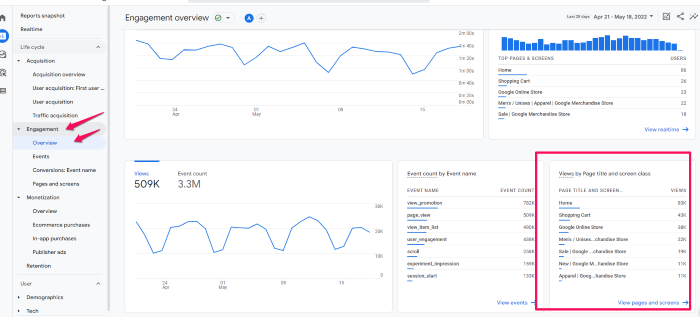
You can also view acquisition, monetization, and user demographics here. If you want to compare different metrics, select the + icon at the top (next to Engagement Overview.)
Customize Your Reports Snapshot
One of my favorite features is the ability to customize the reports snapshot so you can see the data that matters most to you at a glance. This will also help you get to know GA4 a bit better so you are more comfortable using it.
First, let’s create a new report.
To start, click Library at the bottom of the left navigation bar. Note, if you don’t see this option (It’s not in the demo account), it means you don’t have admin access.
Then, scroll down to the Reports table and click Create a new report. Then, select Create an Overview Report. You’ll be asked to provide the data source and GA will walk you through creating the report. (This part changes based on the type of report.)
If you want to change the layout of your overview, click the six dots drag indicator. This will let you drag and drop the cards. To remove cards, click the X icon. If you want to add new cards, select +Add Cards.
Create A New Event
Events are crucial in the new Google Analytics 4—in fact, this is how you’ll track just about everything. You will need an editor role in GA to make these changes, so if you don’t see the options I mention, that may be the issue.
- To create a new event, head to Configure > Events.
- Then click Create Event.
- Choose the data stream (If you have more than one property in GA)
- Tap Create.
- Give your report a name. I suggest creating a naming convention and sticking to it. For example, using <audience location, acquisition channel>, a report might be named “SLO visitors from social” or similar. Creating a standard naming convention will help keep you organized.
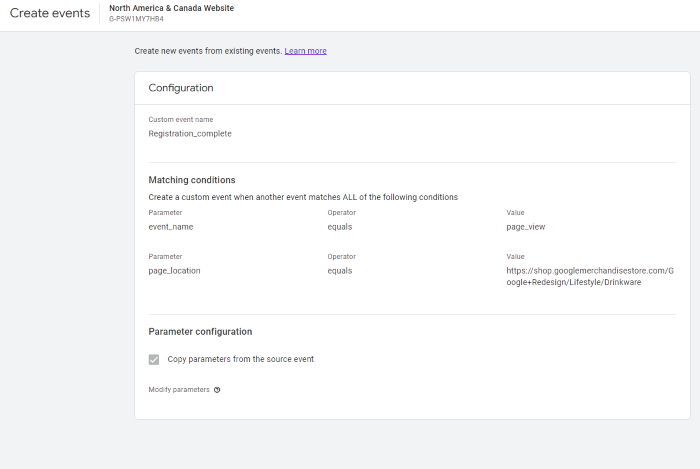
- In the “Matching Conditions” field, enter the existing event this will be based on, such as “click.”
- If you want to use the same parameters as the original event, select “copy parameters from the source event.” For example, if you want your new event to be triggered when a click occurs and already have an event for that, you’d check this box.
- Specify any changes you want to make to the new event. For example, if you want to track when someone clicks and then takes another action, you’d add it here.
See Suggested Audiences
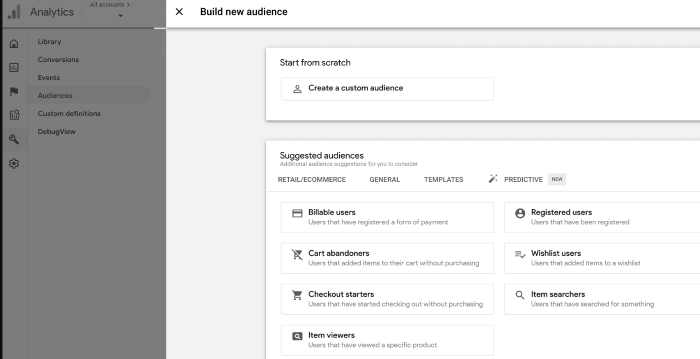
Google Analytics 4 now suggests new audiences. If you’re looking to expand your user base or break into new markets, this can be crucial information. When you create a GA4 property, you’ll tell Google about your business, including your industry category.
Google uses that information to generate new audiences that may be a good fit for your business. To view this data head to Audiences, under the Library. You’ll see suggested audiences listed under Build a New Audience.
Frequently Asked Questions About Google Analytics 4
What is Google Analytics 4?
Google Analytics 4 is a new analytics property offered by Google. It enables users to analyze data from websites, apps, or both websites and apps. It is a complete redesign of GA, so there is a bit of a learning curve.
What is the difference between Google Analytics 4 and the old GA?
The main difference between Google Analytics 4 and the old GA is in what the two different property types track. Google Analytics 4 can track the analytics of both websites and applications, while the old GA can track only website analytics.
Is Google Analytics 4 free?
Similar to Universal Analytics, Google Analytics 4 is a free property type. There are no costs associated with using one (or more) GA4 properties on your account.
Can you run Google Analytics 4 and Universal Analytics at the same time?
Yes, you can currently run both platforms parallel to each other. UA will stop gathering data in july of 2023, so make sure you’ve installed GA4 even if you aren’t ready for the switch quite yet.
Why is Google Analytics 4 so hard to use?
GA4 is extremely customizable, which can make it hard to learn. However, once you get a hang of it, you’ll find you have access to deeper insights you can use to grow your business.
Conclusion
Google Analytics 4 is a powerful analytics tool that provides invaluable insights into your audience. There are numerous benefits to GA4, including cross-platform tracking, more control over data, and AI-driven insights.
Google Analytics 4 is an extremely complex tool that can only be used to the best effect with excellent and in-depth knowledge and practice.
If you would like to consult with experts in this field, please write to us at [email protected] and we will help you implement it.